Follow Lilach
How to create amazing visual content for your marketing campaigns
Visual content has rapidly taken over the Internet, whether it be blogs, social media, and any other kind of digital platform you can think of. And for businesses (of all sizes), entrepreneurs, and marketers, they are a must: on your blog and website, on social media, and on the other platforms you’re using to reach your audience. In this blog post, I’ll show you how to create amazing visual content for your marketing campaigns, easily.
Why you need to create more visual content
Visual content gets people’s attention – and it makes them want to engage and take action.
For one, there is a lot of text-based content out there which makes it difficult to stand out; that’s not to say that text-based content is dead or that you should only create visuals from now on. Rather, it means that visual content will help enhance your overall content marketing strategy, your blog posts, guides, and the like and plus, you can always repurpose your text content and turn it into visuals to reach a larger audience.
For example, if you create a stats-filled post, why not include an infographic as well which can then be shared online by your readers.
Or if you write an amazing value-filled how to guide, you can always turn it into a presentation and reach more people via Slideshare.
If you use content marketing and/or social media marketing to promote your business, then you need to create visual content regularly:
- Posts that include several images can get up to 650% more engagement than text-only
- Infographics are shared 3 times more than other types of content and they can increase your web traffic by up to 12%!
- Visuals gets 37% higher engagement rates on Facebook and 150% more retweets on Twitter
Where and when can you use visual content?
The quick answer is…pretty much anywhere! But, to get down to specifics, you should use visual content:
- On your blog: use visuals to break up blog posts, to better illustrate a point, and to enhance your blog posts with shareable images, infographics, and the like
- On your website and landing pages: all pages on your website should include some sort of visuals as it makes for a much better browsing experience. Plus, use visual content on your landing page to persuade more visitors to buy from you
- On social media: visual social networks have grown massively in popularity (I’m especially looking at you, Instagram!) and because people crave more visual content, they have rapidly taken over all major social networks. Whether it’s live videos, infographics, images, and so on, visuals tend to generate more views and more engagement across social networks (as you’ve seen earlier, they can have a massive impact on your engagement on Twitter and Facebook)
- In your other content marketing campaigns: there are so many different ways that you can incorporate visuals into your content marketing that it would take forever to go through them all: presentations on Slideshare or in your webinars, images in your marketing materials, screenshots in your how-to guides, and many, many more
Try to leverage visual content every time you create a new piece of content, whether it’s a simple image or a complex infographic. It will help boost your traffic, your downloads and shares, and your overall engagement.
So, how do you create amazing visual content?
How to use Visme to create powerful visuals: infographics, presentations, and more
I’m a huge fan of Visme and have been using it for a few years now so I wanted to share with my readers what you can do with it – and how easy it is to use it to create your own visuals, no designers needed.
And no, you don’t need to be a designer yourself or even have much experience; there are enough templates and the builder is easy enough to use that anyone with Internet experience can easily get the hang of it.
So, what is Visme?
It’s a free (although there are a couple of paid plans too if you want more powerful features) visual content creator for businesses, marketers, and educators that you can use to create, among others:
- Interactive infographics
- Animated presentations with smart transitions
- Flowcharts:
- Reports, white papers, proposals, and other types of documents
- Printable flyers
- Menus, invitations, posters, gift certificates, and other types of printable marketing materials
- Email headers
- Blog graphics
- E-books
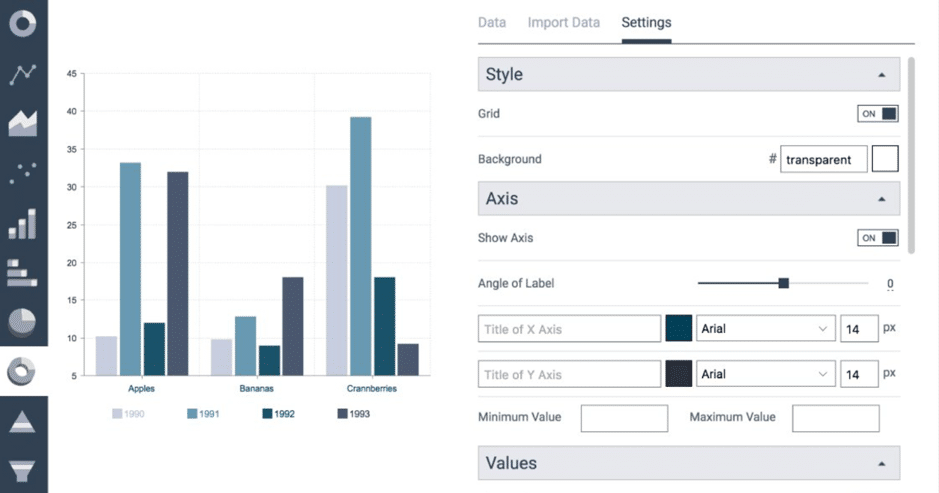
- Charts and reports with static or dynamic data and scatter plots (with an Excel or CSV file or you can even pull live data from Google Sheets, updates each time they are viewed – yes, I had to put it in bold as it’s that cool a feature)
- Social media graphics for all the different types of posts and banners for each major social network (for example, Facebook covers, Twitter Ads, YouTube channel art, and much more)
- Or a custom graphic with the sizes you want
There are dozens and dozens of types of visuals you can create – pretty much any type of visual content that you would need as a business or marketer – but what I really love about it and why I think makes it stand out from the rest is that you also have numerous options to animate and make your visuals more interactive (like adding parallax effects to infographics or adding smart transitions to the slides in your presentations).
Check out the video below for a quick look at what Visme can do:
So, how does it work and how easy is it to use?
How to get started with Visme
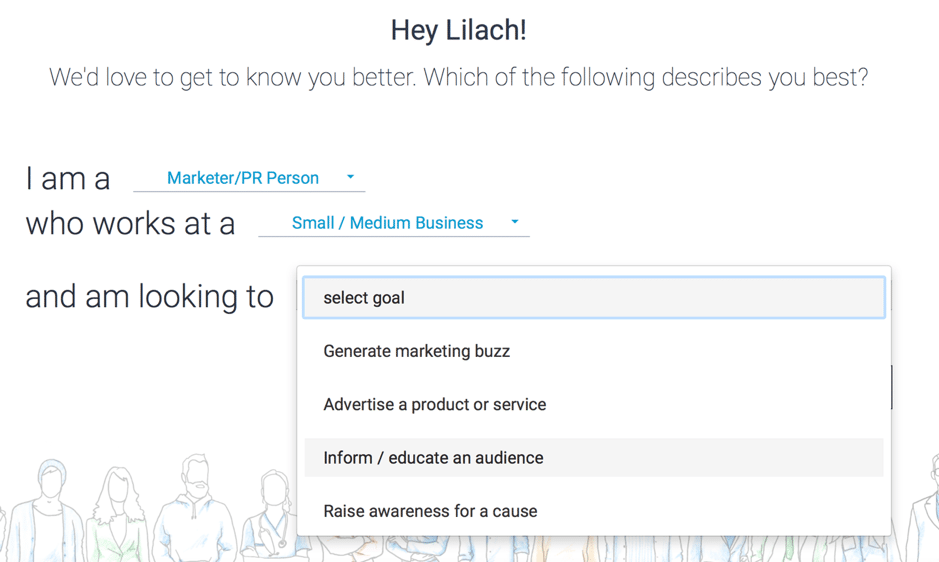
Once you’ve created your Visme account, you can quickly get started on your first project:
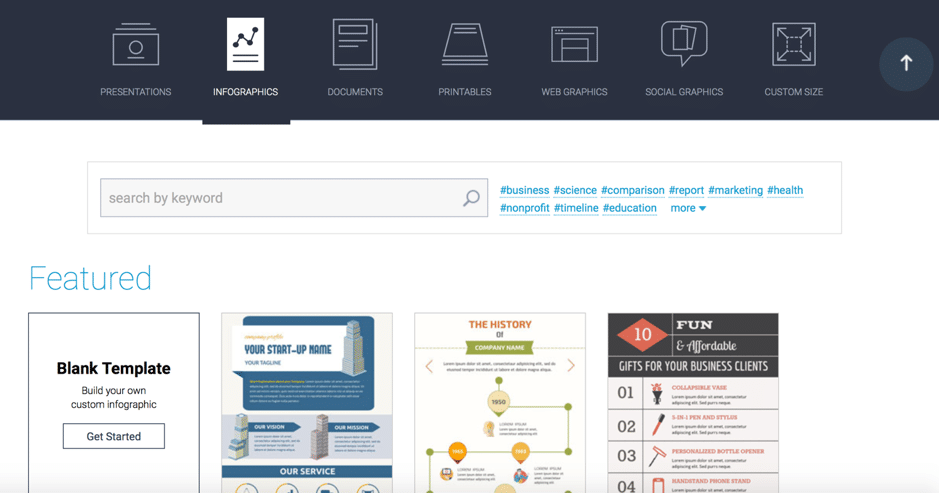
Start by selecting the type of content you want to create (presentation, infographic, and so on) to see what templates they have available:
There are literally hundreds of templates available to choose from (and dozens of types of content), so chances are, there’s something for everyone in there. Plus, you can customize them as much as you want to fit your branding and needs – or, you can build your own graphic using the blank template.
Since there are so many templates, you can always use the search option provided to look up relevant keywords and find the right solution for you.
Once you find what you need, you can start using the builder to customize it. In this case, I’ve chosen an infographic to show you how the builder works.
Quick tip: write down your outline (especially for infographics, presentations, and the like) before you start your design to make sure it’s all cohesive and that you’re including all of the information you need to include. If you’re going to create an infographic, it’s best to do this before you choose the template, to make sure you choose the right one (is it long/short enough? do you have enough space for all of your stats and facts? Is it a list or a comparison infographic?). Back to the builder now:
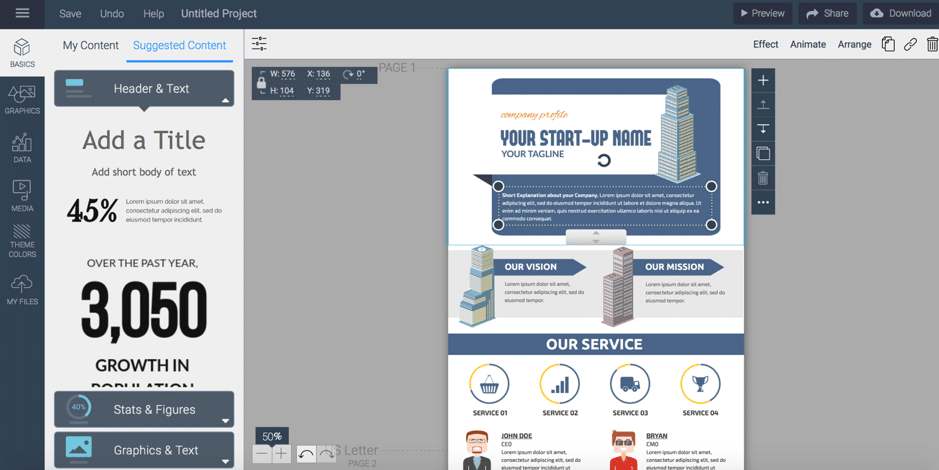
Here’s what the builder looks like once you select the template you want to work on:
In the bottom left-hand side, you can easily zoom in and out as needed, so you can focus on specific parts of your design, or see it as a whole.
Now, it’s time to actually customize your design. To start with, you can click on any text on the template to change the text to whatever you want. Since infographics are a bit more complex than other forms of visual content, Visme uses so-called blocks to separate the different elements in an infographic. These can then be easily moved up and down, duplicated, or deleted, or you can add new blocks if needed.
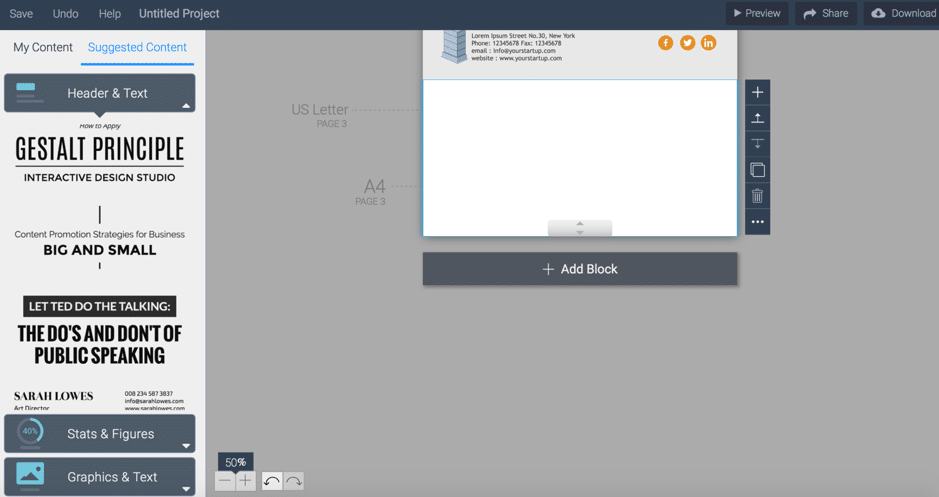
Simply go to the bottom of your infographic and click on “add block” to add a blank space to your infographic:
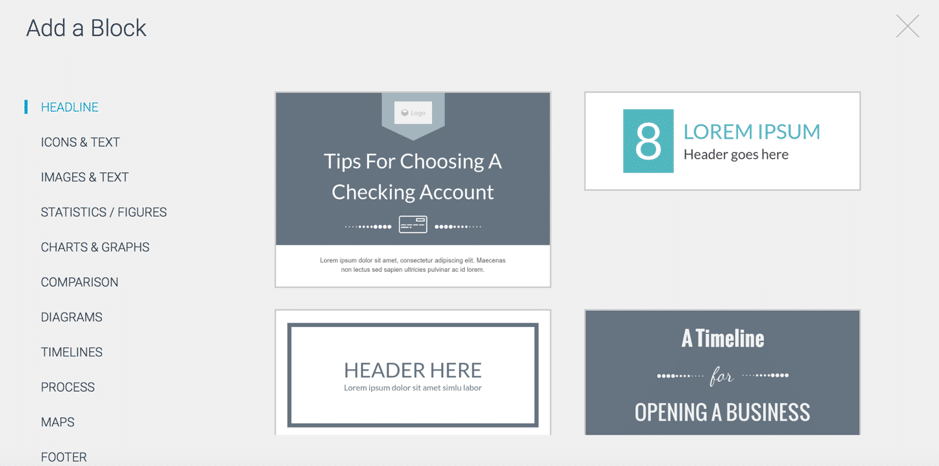
Or, you can click on Add Block From Template, where you’ll find a plethora of options:
As you can see above, there are several types of blocks to choose from; simply click on the type of block you need (headline, a map, a footer, etc.) to see your options, as above for headers.
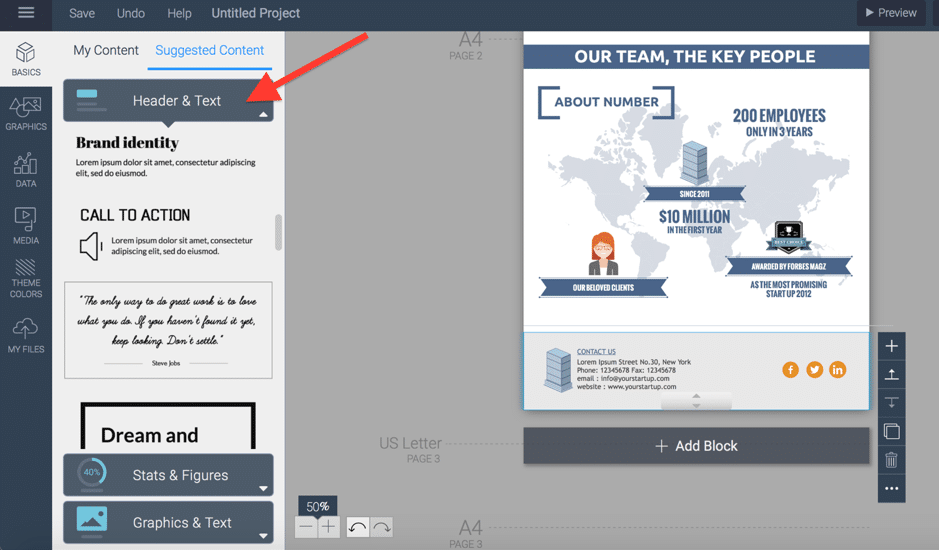
Then, you can easily start customizing your infographic with all kinds of elements, such as Header & Text content:
And, as you can see in this screenshot, you can also find stats & figures and graphics & text elements that can be easily dragged and dropped into your infographic.
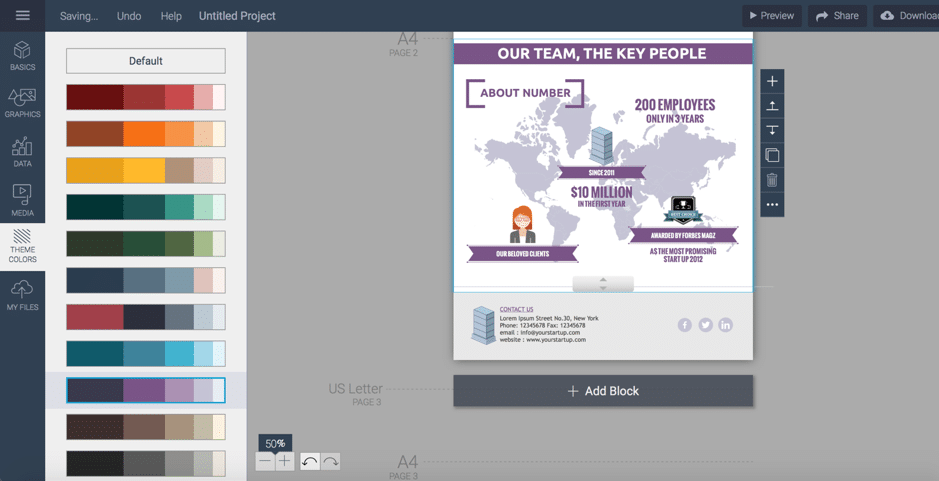
You can also change the colours of your graphic; when you head over to Theme colours, you’ll be able to see all of their colour scheme options and choose the right one for you:
Or, alternatively, you can add your own colours if you want to make sure the content is clearly branded.
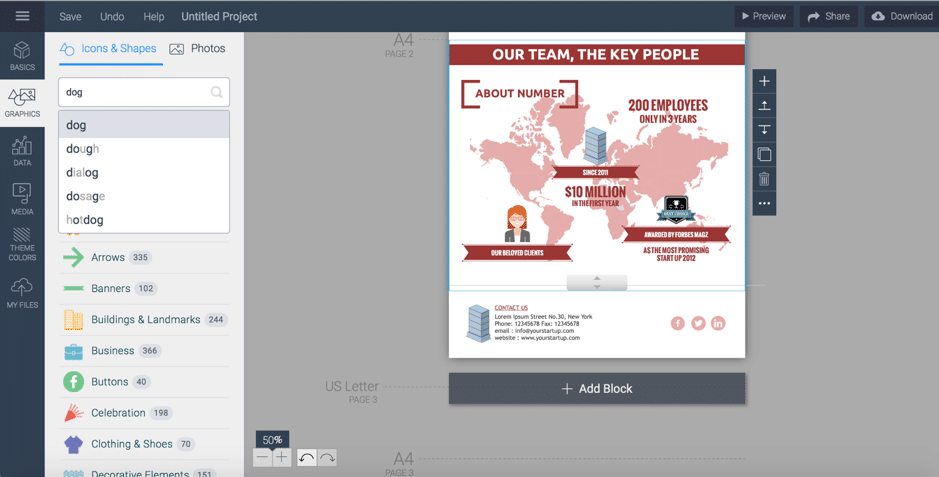
And finally, all that’s left to do is add your text and all kinds of powerful elements to illustrate your point; for example, if you head over to Graphics in the left-hand side menu, you’ll be able to find all kinds of icons and shapes and even free photos, which you can search for using the search bars:
It honestly feels like you have unlimited options – and that’s not even accounting for your own files, which you can easily upload to your asset library for ease of use. For example, add your logo and any marketing images so that every time you’re creating something on Visme, you can just access your asset library to find what you need. You can ever separate them into folders to keep things organised – although if you name each piece of content, you’ll also be able to search through your assets by keywords.
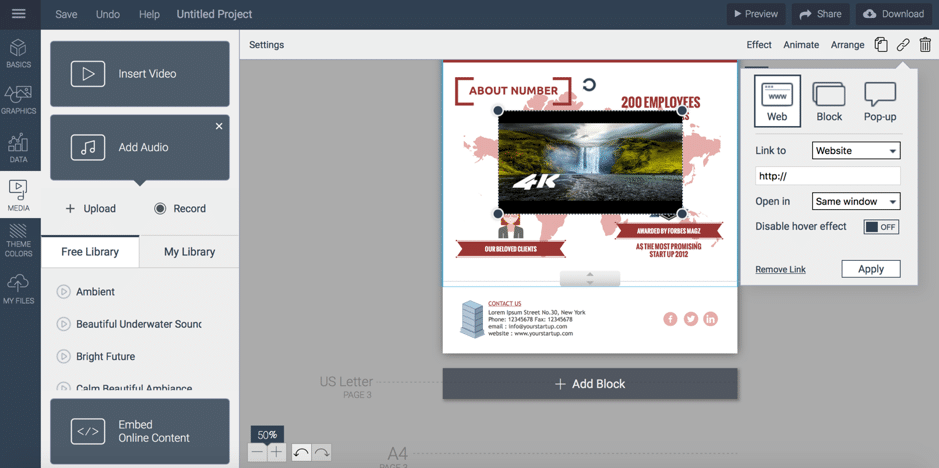
Another option you have is to add media to your infographic: videos, audio, and embeddable online content.
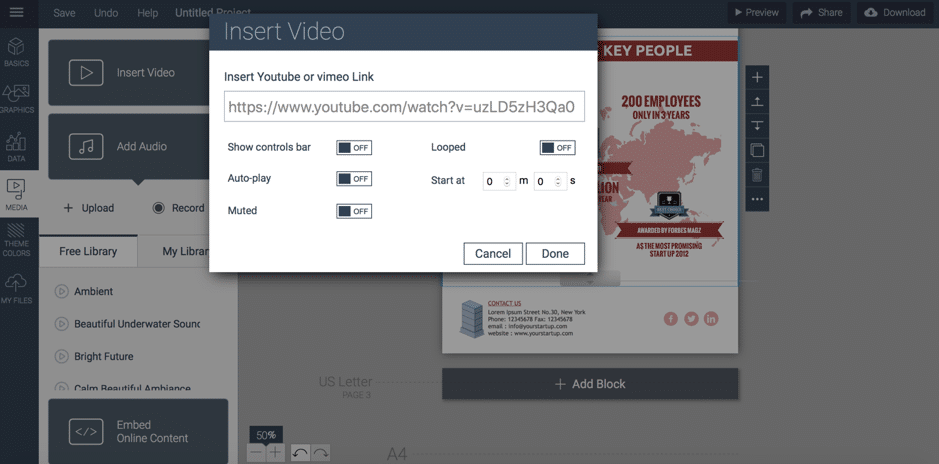
For example, to add a video, all you need is a link to the video from YouTube or Vimeo:
You can even decide at what point you want the video to start (for example, maybe the first 20 seconds aren’t relevant but the rest of the video is), whether you want the video muted or to show the controls bar, whether to play the video on a loop, or whether to add auto-play.
Another option is to add audio to your graphic; search through their free library to find the right audio clip or upload your own.
And finally, if you want to embed any web content, simply click on “Embed Online Content” to copy and paste the code.
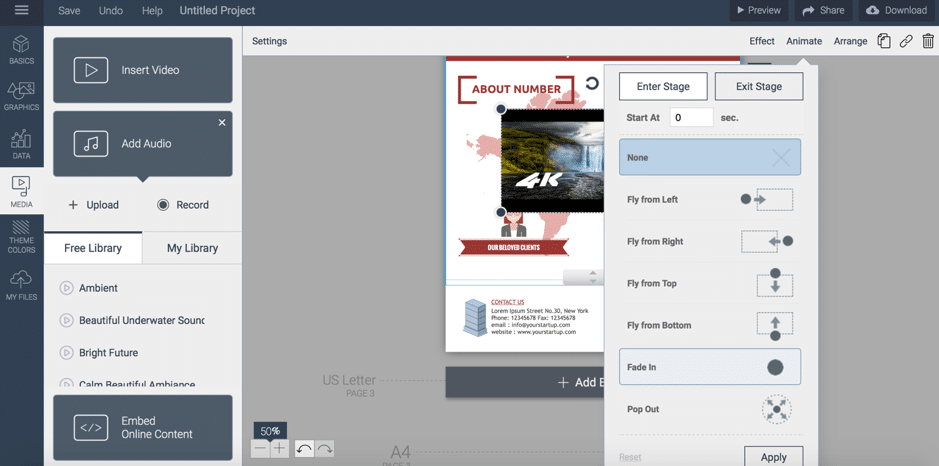
If you want to bring more life to your creation, click on the Animate menu to choose an animation such as having your content fade in or pop out:
As a business or marketer, you’ll be happy to know that you can also add links to your content:
And a really cool (new) feature is that you can actually animate your Infographic by adding parallax scrolling effects; this will help your infographic stand out like a static infographic never could – and really attract people’s attention and interest.
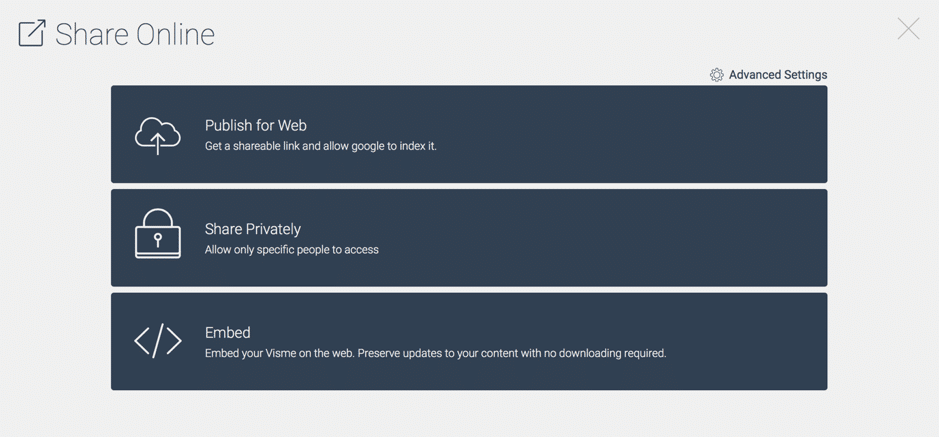
Once finished, you can preview your creation, as well as publish, share it privately, or embed it on the web:
As I mentioned before, there are numerous other types of visual content that you can create with Visme; that said, the builder is very similar for all the different types so once you use the tool for a bit you’ll quickly get the hang of it and be able to create presentation, ebooks, reports, charts, and all kinds of other visual content.
I would definitely recommend you spend some time familiarising yourself with the builder and most importantly, with all the different elements, icons, and design options you have – not just to get the hang of the builder, but also so you can learn what exactly you can create and how you can customize your designs to make them amazing (and completely your own).
I especially encourage you to explore all of the different content types; as I mentioned earlier, there are a plethora of content types and some have some truly amazing features that you won’t find with just any tool – like the afore-mentioned option to populate your charts and reports with live data from a Google Sheet that is automatically updated.
Conclusion
There’s no denying the power of visual content and its impact on marketing strategies. And because you need to create so much content, in many cases on a daily basis (especially when it comes to social media graphics), you need to find a tool that will allow you to create this content easily, without compromising on quality – and Visme is absolutely all that and more.
It’s very easy to get the hang of and you’ll quickly find that you can create some types of content in minutes (such as social media graphics or other images). But it’s not just the ease of use that makes Visme a great option; there’s also the plethora of templates available for each type of design and the incredible amount of customization options that will allow you to turn an existing template into something unique to you.

Follow Lilach


