Follow Lilach
The Small Business Guide to Google Analytics
Google Analytics is one of the most effective tools for analysing your website traffic. The tools available here can show you where your traffic is coming from and how you can improve your website to convert this traffic into sales. The problem for many small businesses is that they have little idea where to start. Google Analytics is a customisable suite of tools that can be quite intimidating when you first open the site. In this post I’m going to show you how can you take this data and turn it into insights that can have a real impact on your business and increase your revenue.
 Understanding Google Analytics
Not every page in Google Analytics is going to be vitally important for every business, but it is identifying the key metrics that you need to track for your business that will make the difference in whether you can use analytics to grow your business. And let us not forget the new Google Consent Mode which allows to remain compliant with local and global laws while tracking data.Let’s start by looking at some of the key parts of Google Analytics and how they can be used.
The first Google Analytics page you will see when you log in is the Overview Screen, which provides all the basic information you need to get started. There is a chart indicating your sites traffic patterns over the last month, with the option to change the date range for the displayed dates, or to compare two date ranges if you prefer.
One helpful feature of these charts is that you can add annotations for particular days. This allows you to track your activities and indicate what caused a particular spike or drop in traffic on any given day. If you are studying trends over a period of time, tracking when your website goes down for a morning, or noting when you received some media coverage that boosted traffic adding these notes is vital so you can tell what techniques are most effective at driving traffic and what isn’t working.
How to create annotations in Google Analytics
Making annotations in Google Analytics is simple. From the overview screen you just need to click on Create new annotation.
Once you select create new annotation a box will pop up and you can enter the information. When the annotation is finished decide whether you want to make it shared or private and press the save button.
Also on the Overview screen you will find more in-depth visitor reports and access to reports covering areas such as, conversions, content, and traffic sources.
 The Visitors Overview Screen
From the visitors overview you are able to see the number of visitors to your website during any chosen time period, the number of unique visitors, and the page views your website has received. Other useful information here includes the percentage of new visits, and the bounce rate. This screen is also where you can learn the average amount of time people are spending on your website. This is vital information for any business, having a large number of visitors to your website is great, but it isn’t very useful if most of them only visit your homepage, and only stay for a few seconds. A high bounce rate suggests that your site is described in a way that is misleading your visitors, or that you are not supplying the information they expect. They are arriving and immediately leaving your site again, so they are clearly not finding what they are looking for. To help improve your bounce rate consider adding the content they are looking for to make your site more valuable to them. It also helps to avoid using “click bait titles”.
[bctt tweet=”Discover how to reduce your #bounce rate on #GoogleAnalytics” username=”lilachbullock”]
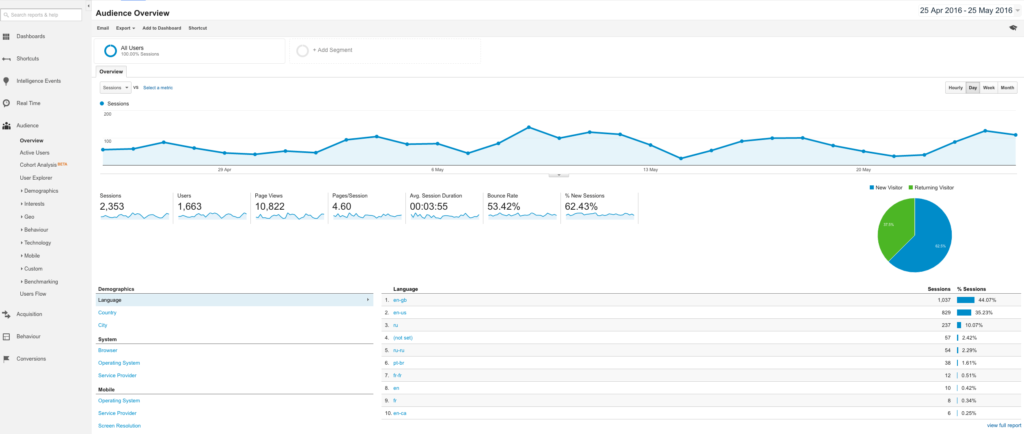
At the bottom of the overview screen you can view demographic information about your visitors, including their location by country, city, and even their language. How useful this information, and the way you use it will depend on the nature of your business.
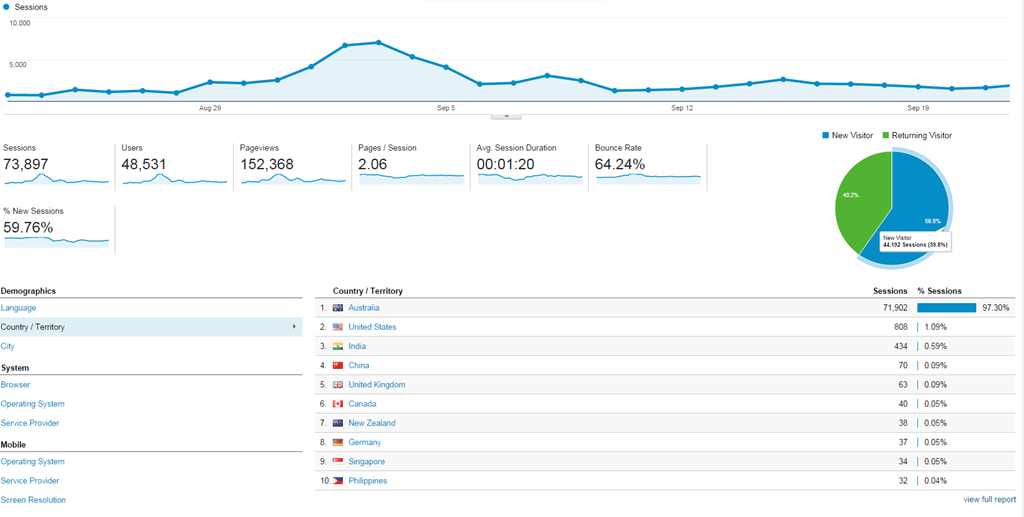
If you are targeting a particular geographic area or a particular age of person then this information can help you to see how effective you are being at reaching your target market. If your business is more general in nature then this information may be less helpful, although it is still beneficial to know which areas of the world you are reaching most effectively, so that you can produce content that is directly relevant to them.
[bctt tweet=”Download the free Small #Business Guide to #GoogleAnalytics & Checklist” username=”lilachbullock”]
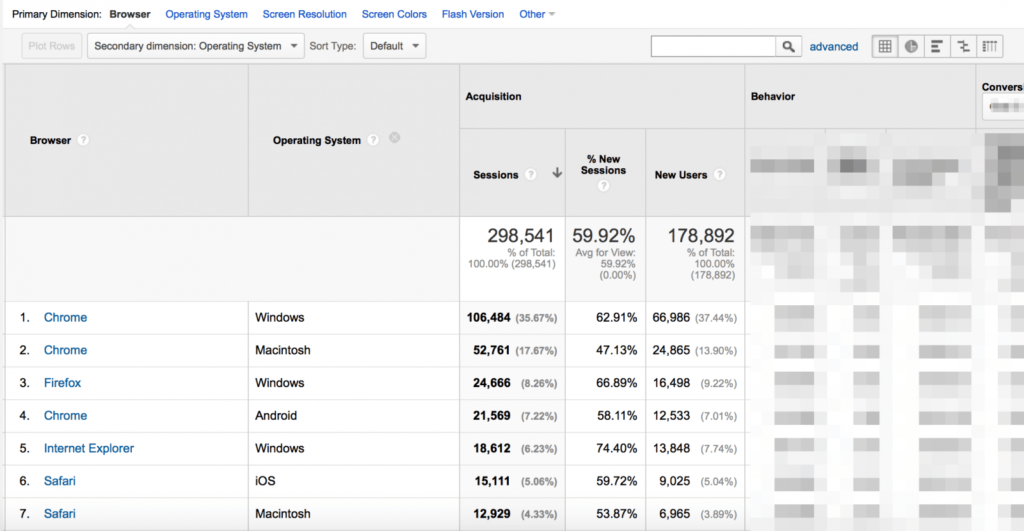
This screen is also the place to find technical information about how your visitors are accessing your site. This includes the operating system they are using and whether they are viewing the site on a PC, Mac or mobile device. This data is not critical from a marketing perspective, but from a technical point of view it is essential. Websites can display differently on different operating systems, and devices. When designing a website it is important to ensure full compatibility with as many systems as possible. By studying this data you can ensure that your website can be properly viewed on the devices your customers are using. If your visitors are not able to access some parts of your website you may be losing out on sales, and making a poor impression on your potential business partners.
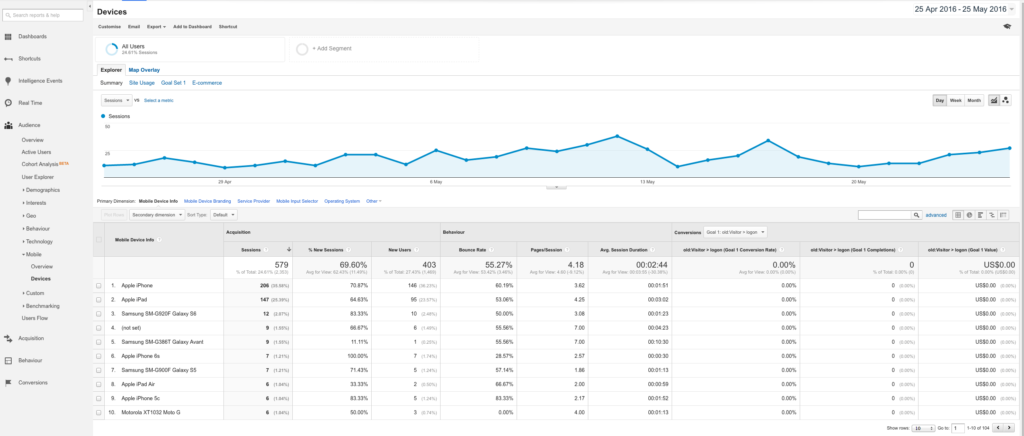
Technical statistics can also be a good way of spotting growing trends, it may be that a particular platform is only used by a small number of your visitors, and you have not given much thought to the way your site is viewed on that device, but if the user figures are growing steadily, even from a very small base, then it is good to start thinking about compatibility now, before you begin losing a large number of sales in the future.
 Traffic Sources
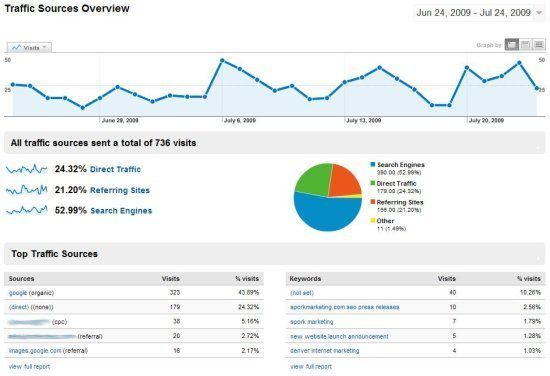
Finding out where you traffic is coming from is vital, and this makes the traffic sources overview one of the most valuable areas of Google analytics. If you don’t know where your traffic is coming from then you don’t know how effective your marketing efforts are being. You are probably putting a lot of effort into SEO, Social media, online marketing and other advertising campaigns. How do you know which of these campaigns are working? Once you can establish the sources of your traffic it is easy to see what is working, what isn’t, and how you need to adjust your marketing efforts to maximise the potential of all the pages on your site.
In an ideal situation, it is best if you can maintain a traffic flow from a variety of sources. If you become too heavily reliant on one source of traffic that is outside your control then you could be facing a potential disaster. For example, if 90% of your traffic is supplied by Google and then Google updates their algorithm and your site is suddenly showing up much lower in their results. Overnight most of your web traffic could disappear leaving your business facing a big drop in revenue. This scenario has occurred in the past to many businesses, which were forced to take urgent measures to attract traffic and recover their position after Google made changes to their ranking algorithms. A Google update would be much easier to deal with if only 30-40% of your traffic came from that search engine. If you can rely on social media platforms to provide a valuable percentage of your website traffic each month then you would be much better placed to weather such a storm. It would only be necessary to increase spending on Adwords or another similar program to make up for the reduced traffic from organic results, until your ranking recovered. The traffic sources screen can also provide an overview of the amount of traffic generated through Google Adwords, which allows you to determine whether your campaigns are worthwhile, or whether the money would be better spent on an alternative advertising method.
Content Overview
The Google Analytics Content overview gives you an indication of which pages on your site receive the most views. The figures on this page should be a lot higher than your visitor numbers because, hopefully, visitors are viewing lots of pages on your website not just your homepage. The most interesting metric here is the unique page view. This figure represents the number of visitors to each page. The general page view number represents the number of times a page was refreshed, or perhaps, when a visitor returned to the page during a browsing session. If you are using Google Adsense, this is where you will be able to find the value of each page in your site. This is incredibly important. Knowing which pages are your key revenue generators enables you to produce more pages similar to them, and generate higher revenue.
Conversions
Conversions are the measure of success for any website. Traffic is great, but unless that traffic leads to sales then you are just wasting your time!
The conversion section of Google Analytics lets users set up goals to track their online sales success. . Users can establish up to four sets of goals to track. The goals you choose will vary depending on the nature of your business. If you are selling directly from your site you might choose to set a destination goal and track the number of times the order confirmation, or thank you page was reached after an order was placed. In other cases you might be more interested in the number of times a certain product was viewed, or information was requested.
It is data like this that will ultimately tell you whether or not your business is succeeding or not.
The four types of Goals you can track are:
- Destination goals
- Visit Duration goals
- Page Visit goals
- Event goals
[bctt tweet=”Understand your website visitors with the Small #Business Guide to #GoogleAnalytics ” username=”lilachbullock”]
Everyone will have different goals, so think carefully about what you need to measure to identify whether success has been achieved. Some suggestions of things to track would be:
- Leads
- Account creations
- Ebook / whitepaper downloads
- Newsletter signups etc.
How to set up Goals
In Google Analytics to set up a destination goal, which treats a page view as a conversion, navigate to the goals section and click New Goal.
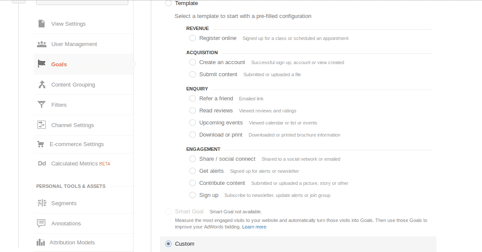
Select Custom
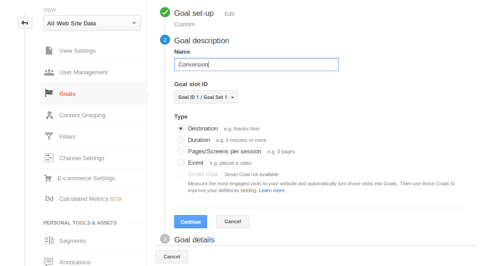
Choose destination goal
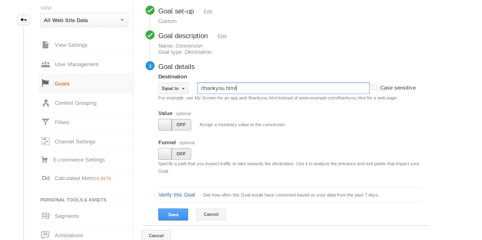
Enter the URL you want to track. Set the match type to Equals to, Begins with, or Regular expression and click save. Your goal is now active.
[bctt tweet=”Learn how to set up #goals in #GoogleAnalytics with the small #business guide to Google Analytics” username=”lilachbullock”]
Custom Reports
One of the most attractive features of Google Analytics is that you can create custom reports. You can filter the results based on criteria that you supply, and then view any of the metrics that can be found in Analytics. It is also possible to add content drill-downs to segment your reports even further. This level of flexibility makes Google Analytics particularly powerful and allows the tracking of metrics that other analytics packages may omit because they are useful to only a small number of businesses.

How to create Custom Reports
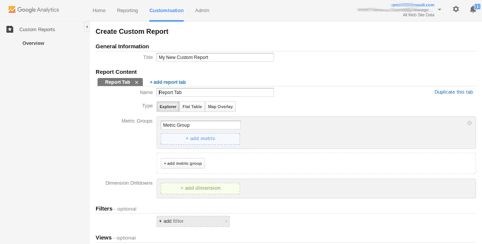
To set a Custom report In Google Analytics start by clicking on the Customisation tab at the top of any page.
Select New Custom Report and enter a title for the report.
Next you need to choose the type of report you want. Choose from Explorer, which is a standard graph line and data table. Flat Table, and Map Overlay
Define the metrics and dimensions for the report; add any filters you want to limit the report in any way you wish.
Click save and you report is now set up.
Custom Alerts
Another example of the flexibility of Google Analytics can be found in custom alerts. Users can set up an alert and define it for almost anything. You can even choose to be alerted by email when an alert is triggered. You can set up an alert for all traffic, or just for traffic segments. If you prefer you can set alerts to notify you of sudden changes in visit numbers or goals.
The benefits of this for website owners are clear. If your traffic hits a sudden spike it is useful to know about it, you will want to find out what is happening and capitalise upon it to maximise the opportunity. You could also set an alert to work the other way. If your website experiences a sudden drop in traffic you will want to be informed so that you can do something about it before the situation deteriorates further.
The accurate, up-to-date information provided by Google Analytics is key to identifying patterns and changes in behaviour in your website visitors, but how can you take this information and convert it into revenue? How can you use Google Analytics to generate conversions and get results from your website?
 Generating Results
Now you know how to use Google Analytics to show you what is already happening on your website it is time to look at how we can use this information to produce some real results which can increase company revenue.
Simply looking though your analytics results doesn’t change anything. If you are serious about benefiting from Google Anaytics then you must take the time to review your results and act on them. Setting aside a full day every month to examine the data and to implement changes would be beneficial.
Key areas that should be reviewed include:
- Keywords – Look at your traffic sources to see which keywords are driving traffic and which need more work. Try optimising your website around the high performing keywords.
- Visits – When do you get most visitors? Arrange to publish new content on the days you receive most visitors.
- Best Performing pages – Knowing what pages receive the most visitors will tell you what type of content is of most interest to your visitors.
[bctt tweet=”Show me the money! Discover how to convert your #website visitors #traffic” username=”lilachbullock”]
Let’s review each of these in detail:
Adding Keywords to your website
From the Traffic Overview section of Google Analytics you can locate your ten best performing keywords. These are the keywords that need to be included throughout your web content. Try to fit them into pages as naturally as possible. Use them as URL anchor text, names for images, etc. It’s a good idea to see if you could write additional pages or series of blog posts based on these keywords.
After dealing with these first ten keywords, locate another set of keywords, based on the amount of time visitors spend on the site. Choose the keywords that generate the longest visits to your site and add these to your other pages on your site as well. Visitors searching for these keywords obviously find your site useful so by making these keywords more prominent you should be able to attract an increased number of similar visitors who would benefit from your site.
What days are most popular with visitors?
The highest traffic days will vary depending on the demographic your website is targeting. Use Google Analytics to identify your most popular days and then use thee days to publish new content.
Make your highest traffic days, the days you publish blog posts, publish events, end competitions etc. By picking high traffic days for these actions you can greatly increase the amount of traffic that your latest updates receive. The same principle applies in reverse. If you need to take your website offline, or make the changes to the site structure Google Analytics can help you pick the times with the smallest amounts of traffic.
Best Performing Pages
The pages with the most traffic on your site are the ones that your visitors find most useful. Look at the Content Overview section of Google Analytics and find your way to the Top Pages report. Work out what information is being displayed on these pages and that will give you a good idea of the type of information your visitors are looking for. Once you have identified this information the next step is to produce more of it. Since they already love this content then it makes sense to increase the amount of it, it’s time to generate fresh content on these topics. Create a content plan for the next few months, which lists topics that are directly relevant to this content.
You could try:
- Directing your social media channels to these pages
- Writing blog posts on these topics
- Creating an ebook to cover these topics in more depth
- You might consider covering these topics in a video
The greater the amount of valuable content you create on topics that your audience loves the more frequently your visitors will return and the more new visitors you will attract.
Summary
Google Analytics is a powerful tool, and by learning to take advantage of all the features that it offers business owners will be able to drive more traffic to their websites and convert more of the traffic once it arrives at their site. Using Google Analytics is a great way to stay ahead of the competition and adapt quickly to changes in visitor behaviour. By learning to provide your visitors with the valuable content they want, your business will continue to thrive in the online world.
And if you’re looking to understand how your traffic is performing better, convert your traffic into more leads and increase sales for your business then get in touch here to see how I can help you!
What have you found to be the most useful Google Analytics metrics for measuring online success? How do you use Google Analytics in your business? Why not leave your answers in the comments? If you have found this article helpful don’t forget to share it with others who may benefit.

Follow Lilach


