

Follow Lilach
How to simplify your marketing reporting using Whatagraph
Data and analytics are some of the most powerful tools we have in our arsenal, whether you’re a marketer, an agency, a freelancer or a business.
By leveraging analytics, you can learn more about your audience; understand what works and what doesn’t; and find the best ways to improve your strategies and consequently, your results.
However, while that might sound good and easy, as any seasoned marketer will tell you… it’s really not that easy. You have to pull data from so many different sources – social media, social ads and PPC, search engines, etc. – and put it all together in a way that makes sense and is easy to understand.
And you pretty much have to do this several times every month – even more so if you offer this as a service to clients.
That’s why in this blog post, I’m going to show you the easiest way to keep track of your marketing ROI, using Whatagraph agency reporting software.
What is Whatagraph?
As you might already know, I’m a huge fan of analytics; which is why I’m very excited to introduce you to Whatagraph (unless you’re already familiar with them, of course ☺).
In a nutshell, Whatagraph is a powerful reporting tool that can be used for various purposes:
- Agencies can use it to deliver automated white label reports to their clients and demonstrate the ROI of their work;
- Businesses can use it to keep track of their digital marketing results, as well as to keep track of their marketing ROI and use that information to keep improving their strategies;
- Marketers and freelancers can use it to show the results of their work and their strategies, to their clients or to the companies they work with.
All of your reports can easily be automated so that data is gathered automatically – as well as sent to the right people, when needed.
[click_to_tweet tweet=”How to simplify your #marketing reporting using @Whatagraph #marketingtools ” quote=”How to simplify your #marketing reporting using @Whatagraph #marketingtools “]
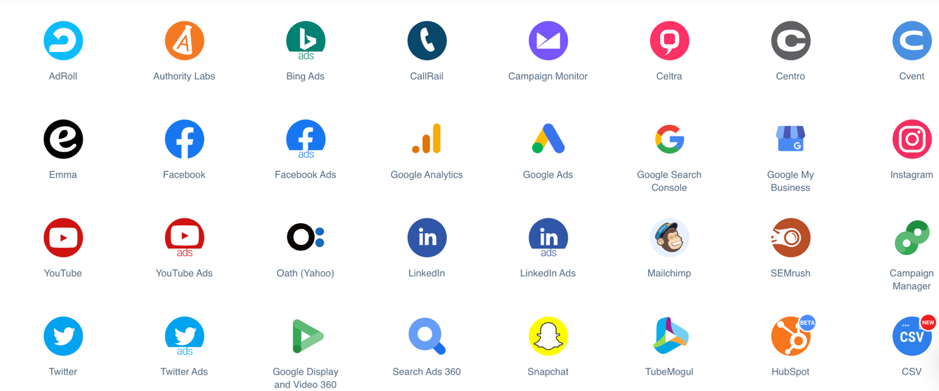
As for what kind of data you can include in your reports, Whatagraph connects to a plethora of tools and apps, including all major social networks (YouTube, Twitter, Facebook, etc.), social media advertising platforms, email marketing tools, web analytics tools and Google Search Console, among many others:
Getting started with Whatagraph
So how does Whatagraph work? What do the reports look like and what kind of data can you pull?
The first thing you should do is set up your Clients – and then adjust the settings for each one: when to send them the reports, white labelling your reports and adding the appropriate data sources and the admin for that particular client:
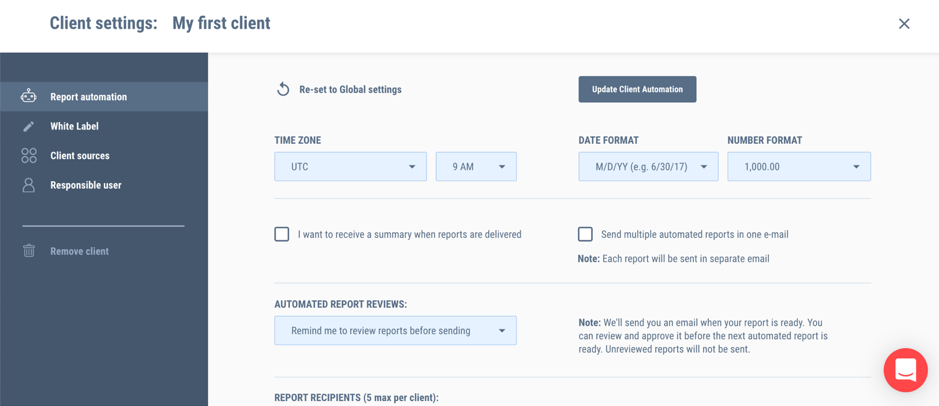
The first question to answer is: when should Whatagraph send your reports to clients? And who should it send it to?
As you can see in the above screenshot, you can set the time zone for that particular client, as well as the time when you want to send the report. Plus, you can choose to also receive a summary whenever a new report is delivered, to keep you abreast of the results.
If you want your reports to be completely automated, you can do so; or, you can choose to be reminded to review a report before it’s sent:
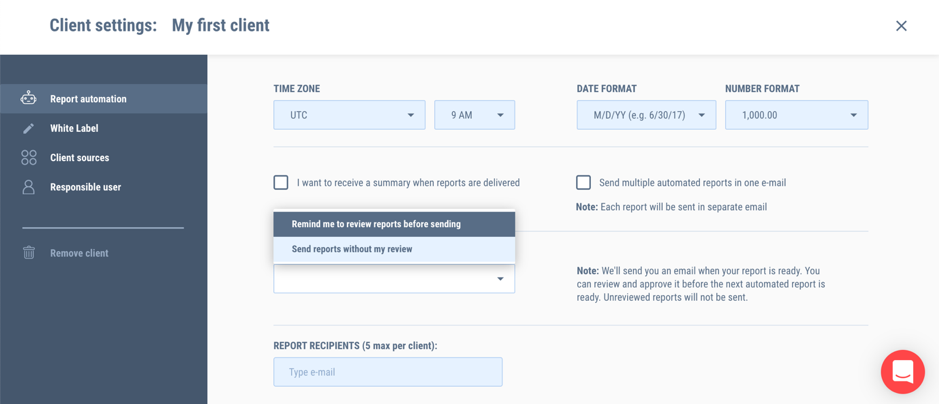
As for sending your report, you can send it to various email addresses and the number of recipients depends on the plan you purchase.
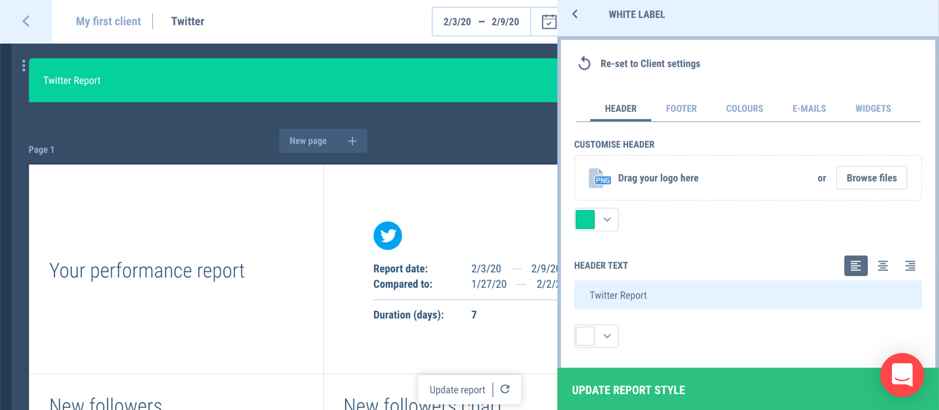
Another thing you can do at this stage is white label marketing report; this is particularly useful for agencies and marketers as they can customize the report with their own logo, as well as with the respective clients’ branding (and impress them!):
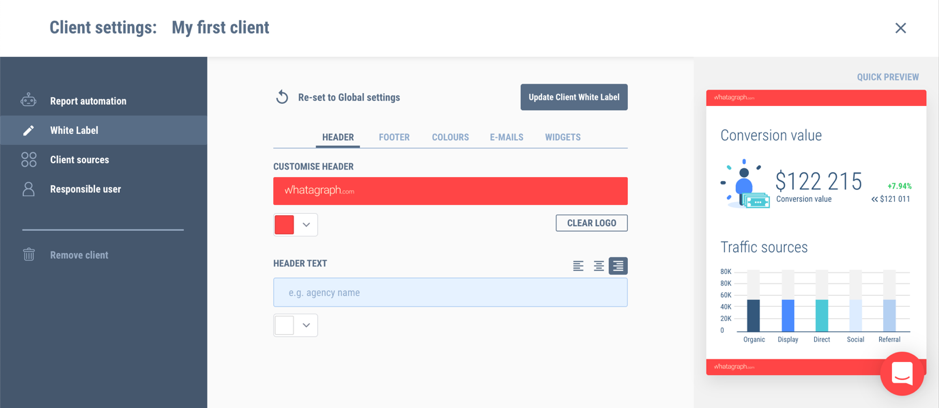
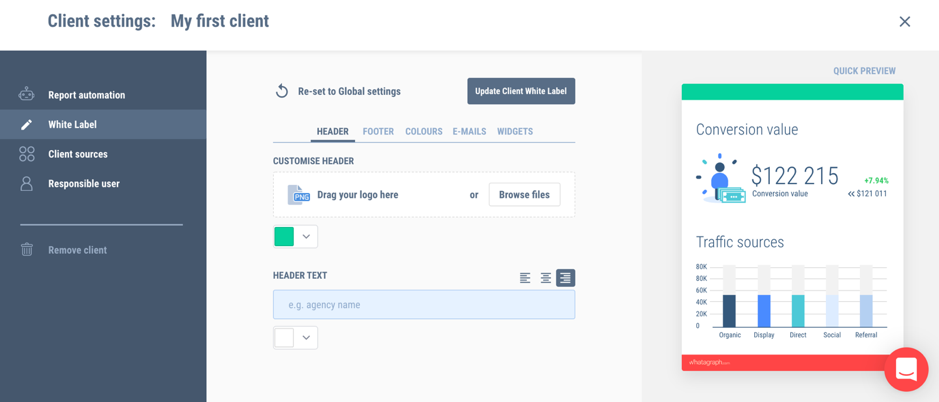
There are numerous customization options here; you can customize the headers and footers of your reports, including the text to be included (if any), the logo displayed and the colour used:
After customizing your header and footer, you can also decide what colours to use throughout the report:
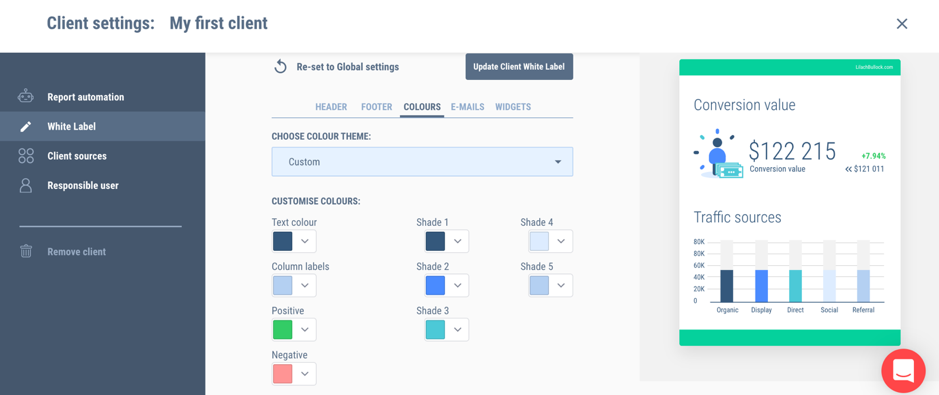
There are multiple themes you can choose from, or you can add each colour as needed. Plus, as you can see above, it’s clearly marked which colour is for what (positive and negative data, text colour and column labels, as well as the various shades included in the report).
Also in this section, you can customize the email you’ll send to your clients:
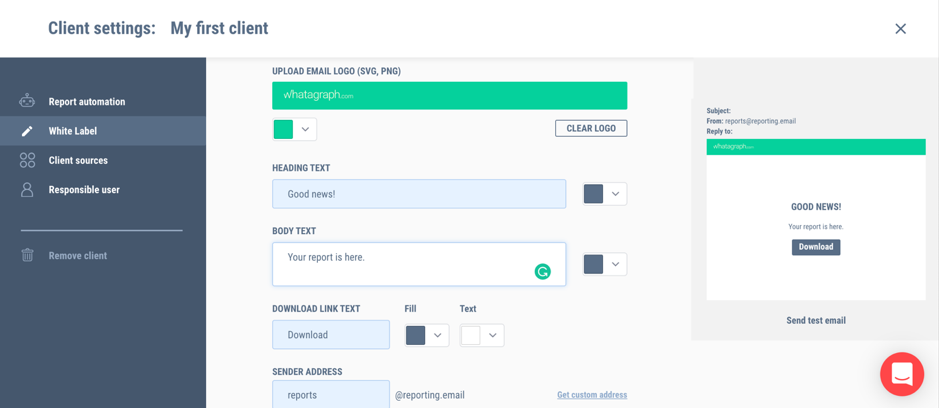
You can use your colours for the header, as well as add your logo, pick a subject line and then write the body of the email, as well as add a download button and a sender address, amongst other customization options.
Also in the settings for each client, you can add all of their data sources; simply click on “add source” and browse through the various categories (or use the search bar provided) to find the sources and tools you want to connect with:
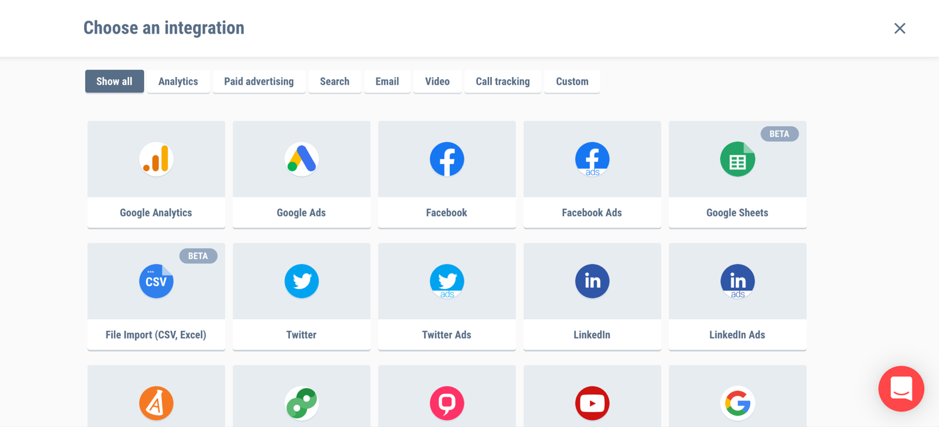
As mentioned earlier, there are numerous integrations available, including web analytics, search engine marketing tools like Authority Labs and Google Search Console, paid advertising services (social media, PPC ads and advertising tools), email marketing software (MailChimp, Campaign Monitor and Emma), YouTube and custom integrations through Google Sheets or by importing an Excel file or CSV, which need to follow a specific outline which can be found in Whatagraph’s knowledge base.
However, if you need to add additional analytics sources for a particular report (even if you didn’t add it in the settings for that client), you can easily do so from the report builder.
Once you’ve finished setting up a client, you can easily add more client folders to have them all clearly organized:
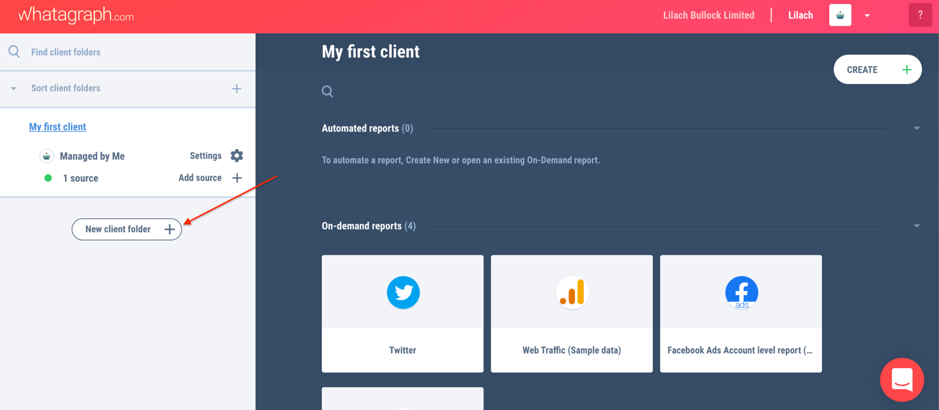
All of your client folders will then appear on the left-hand side of your dashboard, where you can order them as needed.
Building a report
Now, let’s get to the fun stuff: building reports.
The first thing you see when you click on “create” to set up a new report, is a template library:
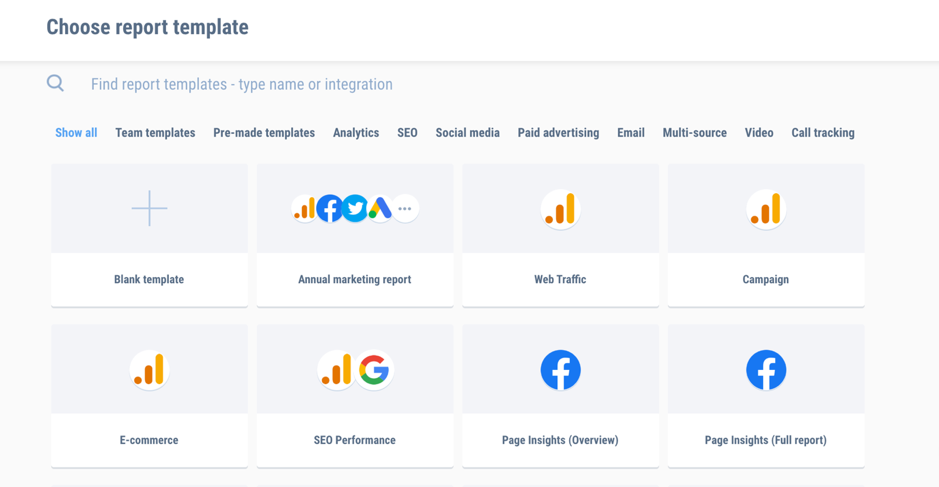
You can begin with a blank template, of course, which means you can design the entire report exactly as you need it; that said, you also have access to a plethora of templates which you can customize as much as you want – which makes the entire process so much easier and faster.
[click_to_tweet tweet=”How to simplify your #marketing reporting using @Whatagraph #marketingtools ” quote=”How to simplify your #marketing reporting using @Whatagraph #marketingtools “]
As you might’ve noticed in the previous screenshot, the templates are organized into categories (such as social media, SEO, paid advertising and so on); you can also search through them using the search bar provided.
Plus, there’s also a multi-source category with several pre-made templates; which is quite useful because you sometimes need a full picture of your results, across different sources: social media, your website, your advertising efforts and so on.
In my case, I’ll start with my favourite – Twitter – and try to build a report that can give me a full picture of my Twitter performance:
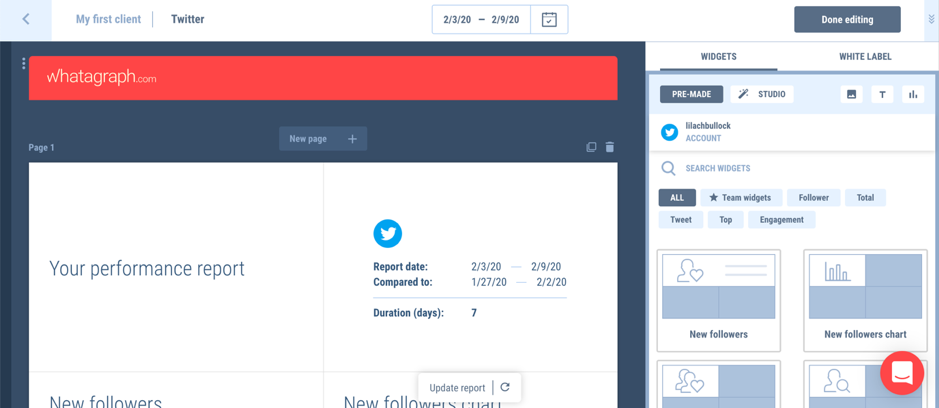
As you can see above, the editor is located on the right-hand side of the screen; as I click on an element from the report, I can then edit that element in the editor:
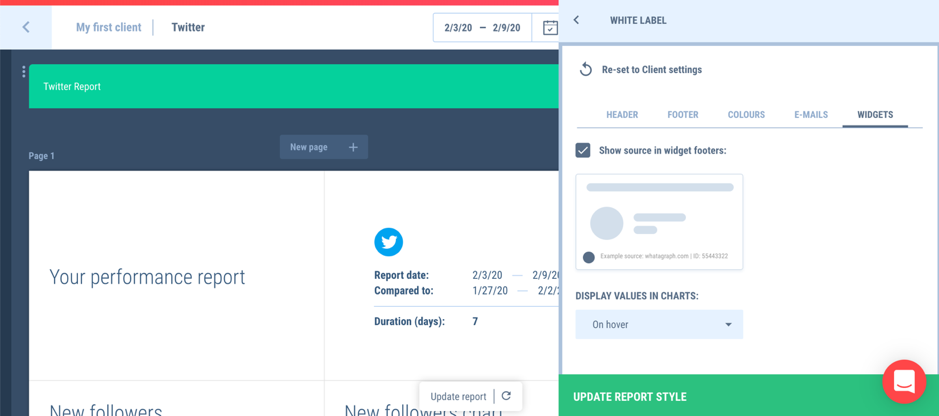
I started with the header as that allows me to customize the report’s look; the colours used for the header and footer as well as throughout the report and the look and message of the emails sent of this report. I can also choose whether to show traffic sources under each widget from the report, as well as when to show them (always on or only visible if hovering):
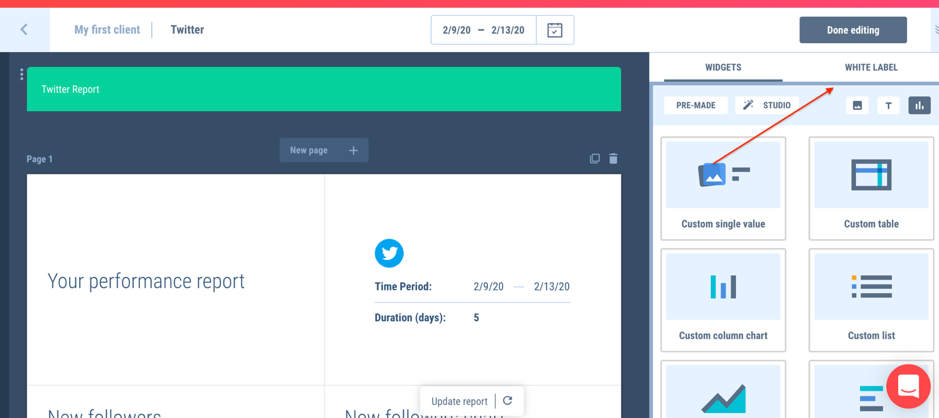
You can also access the report style editor by clicking directly on White Label in the right-hand side editor:
One of the first things you’ll probably want to do is set the dates that you want to track, which you can easily do by clicking on the dates at the top of the screen and adding the time period you prefer. Plus, you can also choose whether you want to compare this data to a previous time period of your choice:
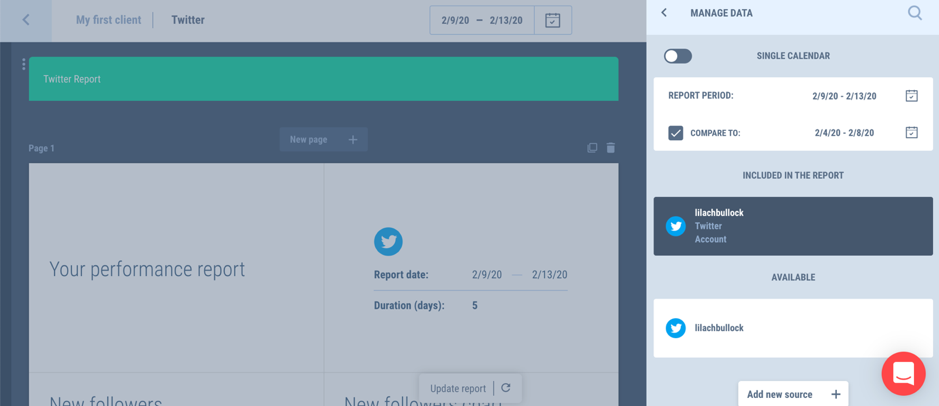
It’s worth noting that some data sources don’t allow tools to gather historical data; because of this, it will only start pulling data from the moment you connected that source to Whatagraph, these include Instagram Business, Twitter organic, Mailchimp and LinkedIn.
Back to the builder though, once you’ve set the time period you want to track (and/or compare it to), you can start customizing the actual report:
- Adding new pages to your report
- Removing or adding new widgets to the report
- Moving widgets around by dragging and dropping them where you want them
- Editing widgets
As I mentioned earlier, if you want to edit an existing widget, all you have to do is click on it; this will take you the editor, which is different depending on the type of widget you’re currently editing. However, generally, you can edit pretty much any element in that widget.
[click_to_tweet tweet=”How to simplify your #marketing reporting using @Whatagraph #marketingtools ” quote=”How to simplify your #marketing reporting using @Whatagraph #marketingtools “]
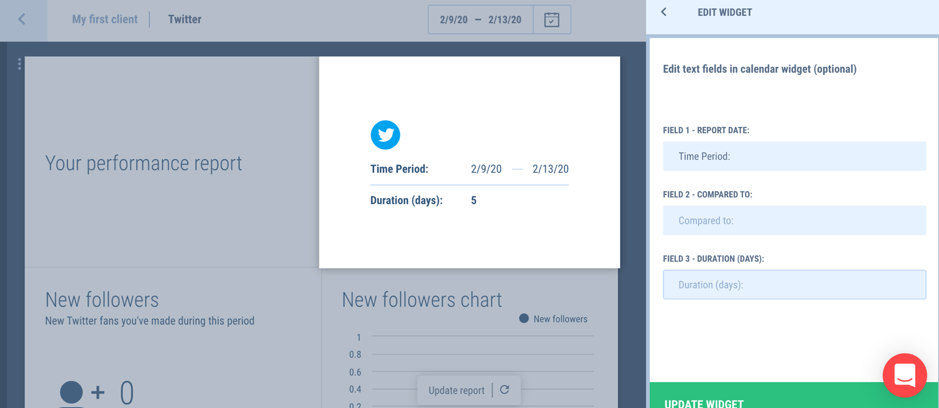
For example, I can edit the wording used in this introductory widget that explains what the report is about/what time period it’s tracking:
When it comes to widgets with data though, the options change; with this “new followers” chart, for example, I can change the metrics being tracked by clicking on the metric, in the builder:
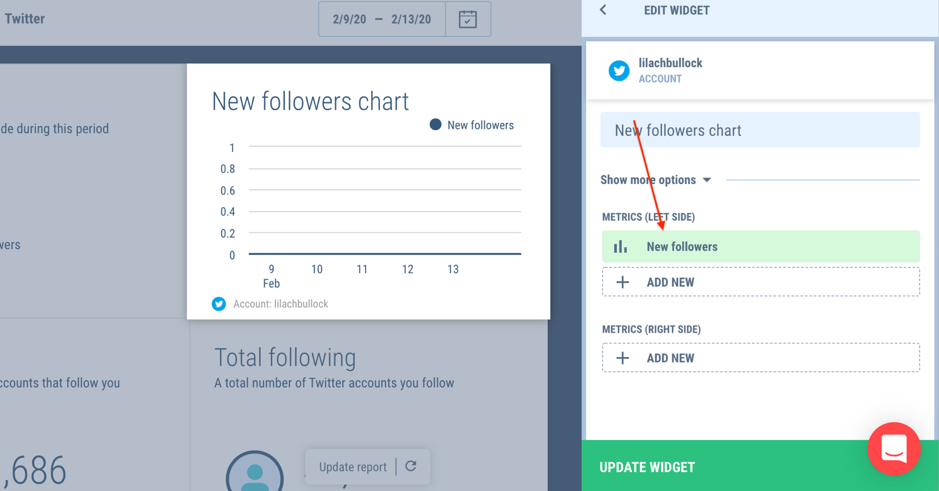
As well as add new metrics to that chart by clicking on “add new”; and, I can also add more, side-by-side by clicking on “add new” under the “right-side metrics”:
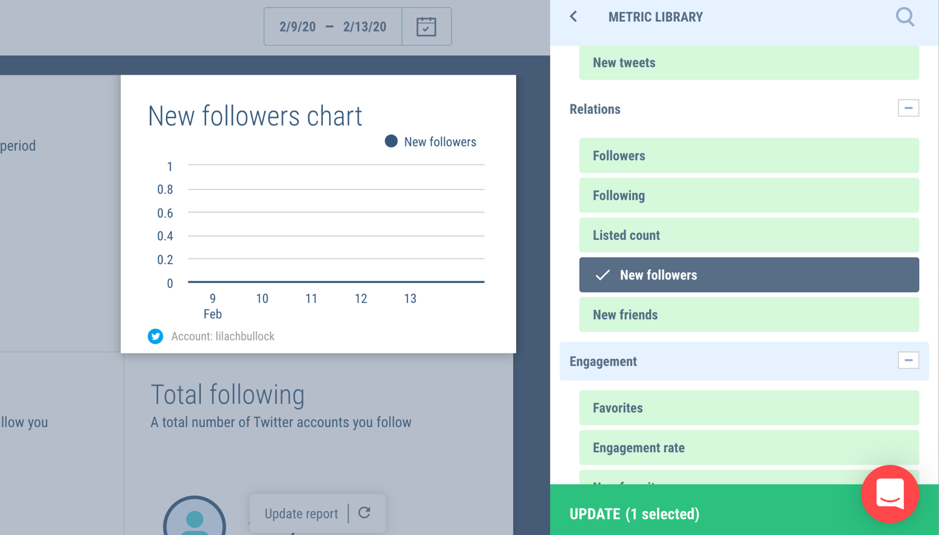
There are several options available although these will vastly differ based on the source of data you’re tracking.
As I mentioned earlier, I can also add new pages and widgets to my report; there’s a “new page” button at the top and bottom of every page of your report, depending on where you want the page to be located.
As for the other widgets you can add to your report, you can find them all in the right-hand side editor:
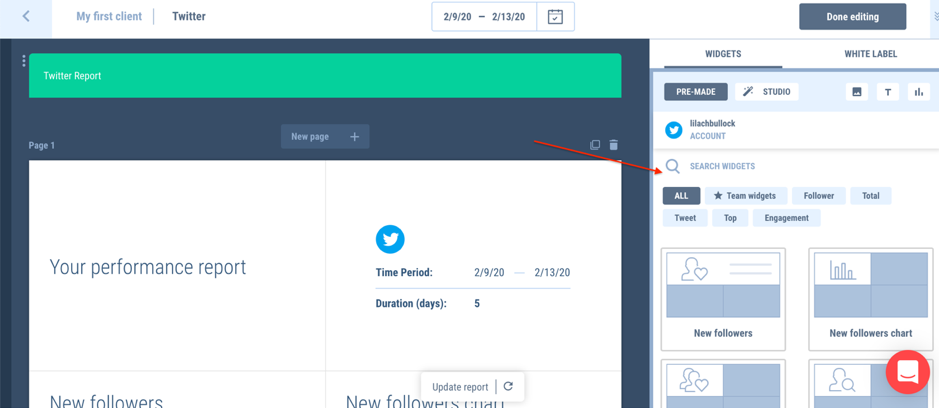
You can search for widgets using the search bar (or by filtering the categories available); a really useful feature though is that you can also save widgets as templates, which will then appear in the “team widgets” category.
If you can’t find the widget you’re looking for, you can also build your own exactly as you need it; just click on Studio to go to the widget builder:
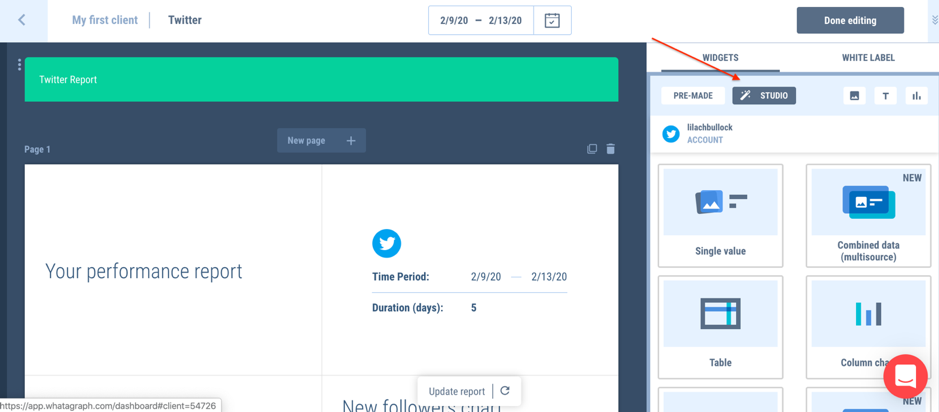
There are various options here, including:
- Tables
- Combined data widgets
- Column charts
- Lists and combined lists (with multiple data sources)
- Area charts, bar charts and line charts
As well as quite a few other types of charts and tables that you can edit to your liking.
To add a new widget – whether premade or custom – you can do so easily by dragging and dropping it with your mouse.
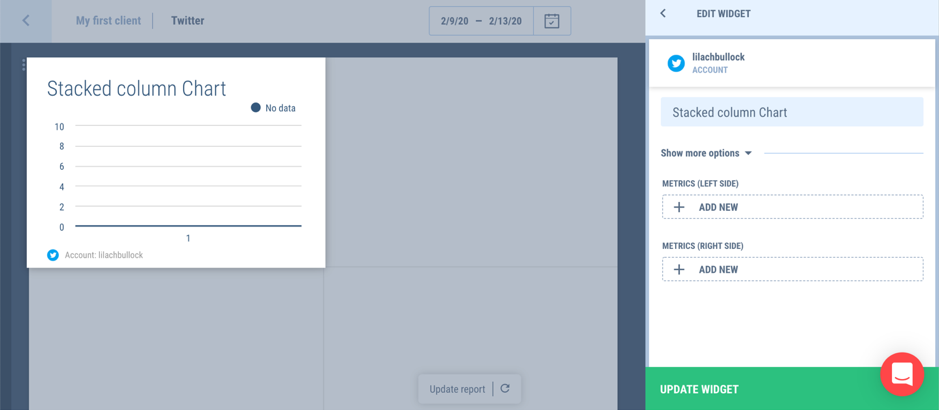
Then, once added to your report, simply click on it to edit it (wording and data):
If you want, you can further customize your report by adding an image to it, adding a comments section where you can leave your comments, as well as add offline data to your report:
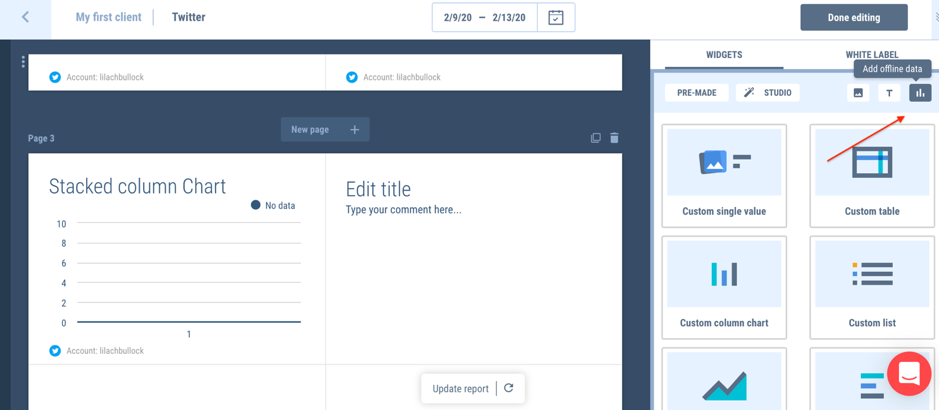
Each of the templates I’ve tried out offer a very large range of data you can pull. Basically, whatever data the tool or service generates, you can add it to your reports, using the numerous widgets.
Sharing and automating your reports
Once you’ve finished putting together a report, you have multiple options:
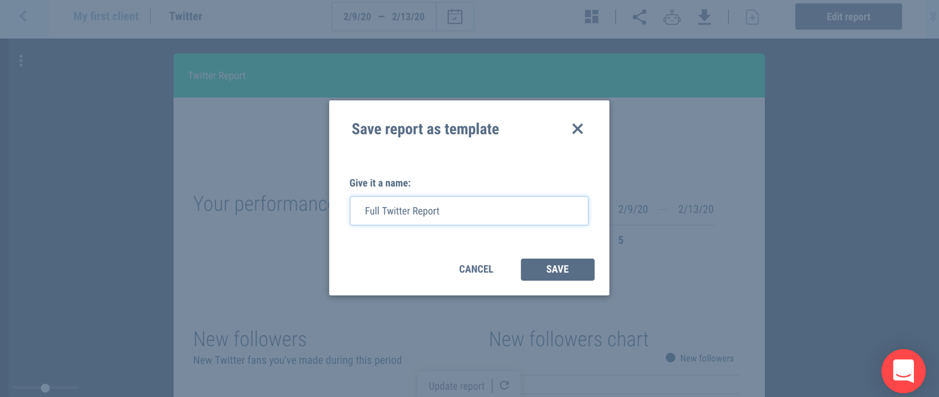
- Save your report as a template: if you want to use the same data for reports for different clients, you can easily save your report as a template – then, you can easily add it to another client and only make small changes to personalize it
- Publish as a live report: one way to publish and share your report is to publish it as a live report; this generates a link that you can share with whoever you want and if you want to secure access, you can also add a password:
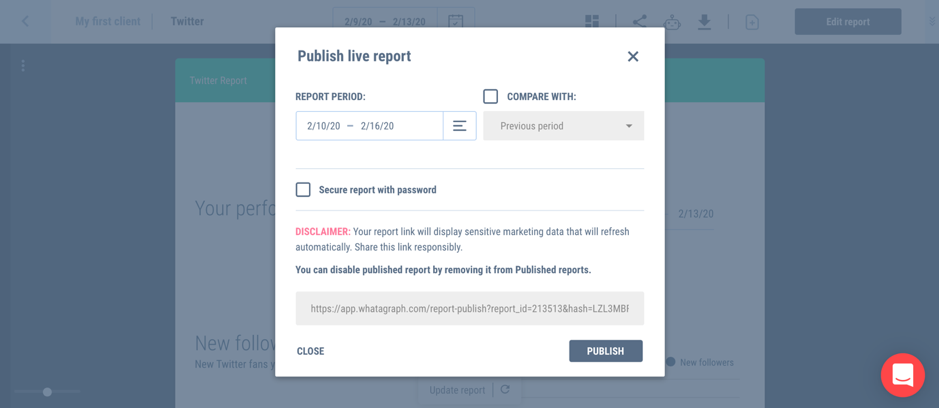
When you publish as a live report, the people you share it with will also be able to manipulate the date ranges themselves without necessarily being a user of Whatagraph.
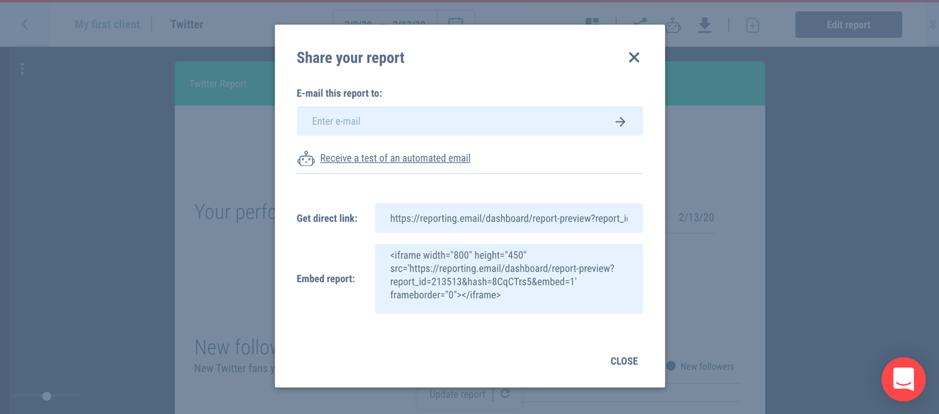
- Share your report: there are actually several useful options here: you can embed your report (just grab the code and add it wherever you want it), get a direct link to share with whoever you want, or email it to people directly:
- Download your report, if you want to keep evidence of it
- Automate your report: best of all, you can also automate your report and have it sent regularly to anyone you want:
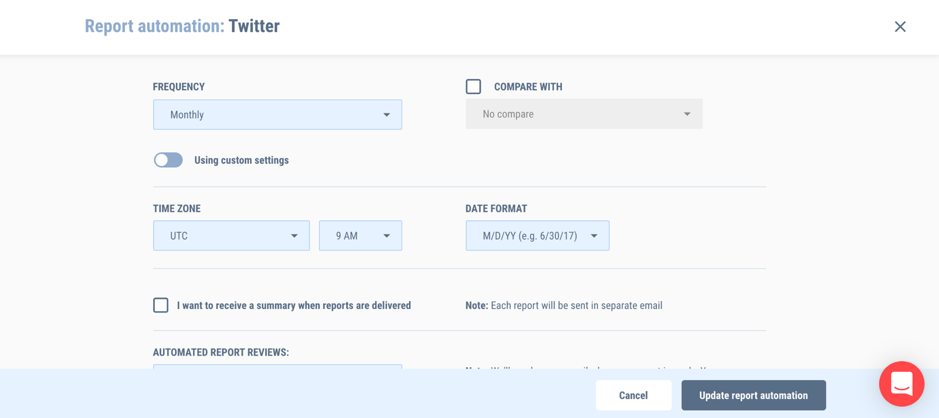
You can easily set the sending frequency, whether you want it to compare with a previous time period, and whether you want to preview the report before it’s sent, every time.
You can also set the time zone (that way, you can send it at a convenient time for any time zone) and add various recipients at once.
Once you’ve set all this up, Whatagraph will automatically send all of these reports, as per your settings, unless you choose to stop them.
[click_to_tweet tweet=”How to simplify your #marketing reporting using @Whatagraph #marketingtools ” quote=”How to simplify your #marketing reporting using @Whatagraph #marketingtools “]
Conclusion
Reporting is an essential aspect of a campaigns’ success: if you want to get results, you first need to understand them. You need to know what works and what doesn’t work, you need to find out what campaigns to optimize in order to improve your results, and you need to know the ROI of your marketing campaigns.
This is what clients also expect: they want to know what the ROI of their campaigns are and how their results are improving.
And if you want to speed up that process considerably – and not have to build reports completely from scratch, pulling data from many different sources – you need a tool to help. Whatagraph is not only super easy to set up, but it connects with a huge variety of data sources, which means you can create reports for pretty much any marketing activity. Most importantly, once you’ve set up your reports and automated them, you barely even have to use the tool at all – it does it all automatically for you.

Follow Lilach